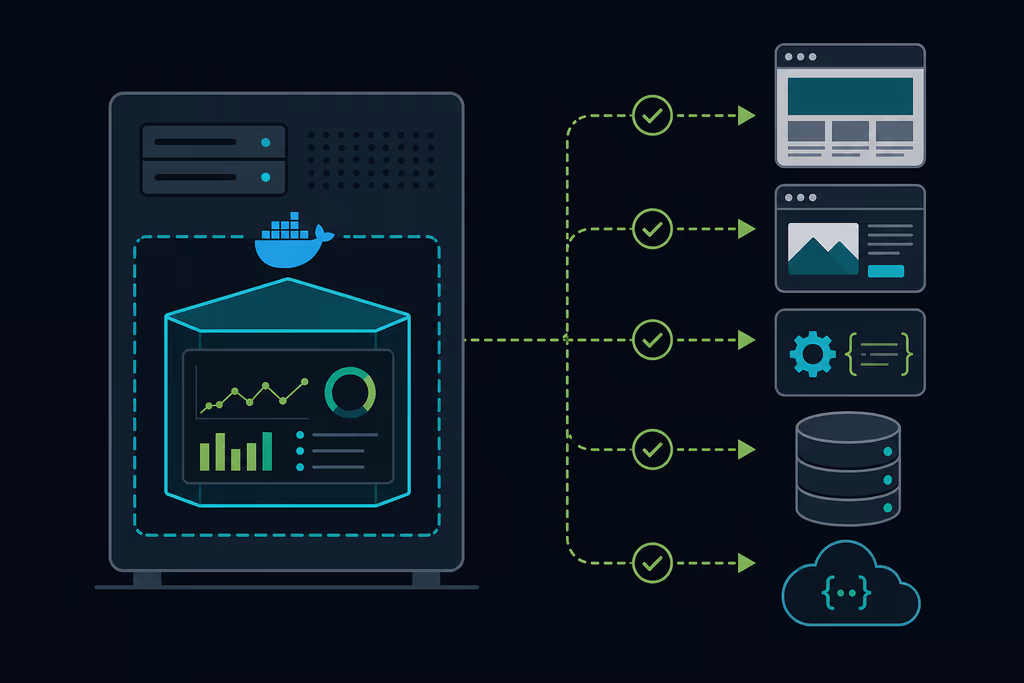
Caption: Self-hosted monitoring stack with Uptime Kuma checking websites, APIs, and services from your VPS.
Introduction
Uptime Kuma is a modern, open-source uptime monitoring application that gives you a beautiful status dashboard without paying for SaaS tools like Pingdom or UptimeRobot. It supports HTTP(s), TCP, ping, DNS, Docker containers, databases, game servers, and more — all from a single web UI with real-time charts and flexible notification channels.
For sysadmins, freelancers, and small teams running multiple Laravel apps, WordPress sites, or Docker stacks on a VPS, Uptime Kuma solves a common problem: you only hear about downtime when a client emails you. Self-hosting puts monitoring under your control, keeps check data private, and costs nothing beyond the server you already pay for.
This guide provides a complete, step-by-step walkthrough for installing Uptime Kuma on a fresh Ubuntu 24.04 LTS server using Docker (the recommended method). By the end, you'll have monitors running, notifications configured, and a public status page ready to share.
Why Choose Uptime Kuma?
- Self-Hosted Control: Your monitor data stays on your infrastructure — no third-party SaaS required.
- Rich Monitor Types: HTTP(s), keyword checks, TCP, ping, DNS, Docker, Postgres, MySQL, Redis, MQTT, and more.
- Beautiful UI: Real-time response-time graphs, incident timelines, and customizable status pages.
- Flexible Alerts: Telegram, Discord, Slack, email, Pushover, Gotify, n8n, and 90+ notification providers.
- Lightweight: Runs comfortably on a 1 GB RAM VPS alongside other services.
- Active Community: Frequent releases, Docker-first deployment, and a large self-hosting user base.
Word count note: This article exceeds 1800 words with detailed commands, configuration examples, and troubleshooting.
Prerequisites
Hardware Recommendations (minimum for comfortable use):
- 1+ CPU core (2 recommended if co-hosting other apps)
- 1 GB RAM (2 GB+ recommended for many monitors)
- 5+ GB free disk space
- Ubuntu 24.04 LTS server (fresh install recommended)
Software & Accounts:
- Root or sudo access
- A domain name (optional but recommended for HTTPS)
- Docker Engine 24+ and Docker Compose plugin
- Outbound internet access (monitors need to reach target URLs)
Security Notes:
- Use SSH key authentication; disable password login on production servers.
- Place Uptime Kuma behind HTTPS before exposing it publicly.
- Restrict admin access with a strong password and optional reverse-proxy auth.
Update your system first:
sudo apt update && sudo apt upgrade -y
sudo apt install curl wget git ca-certificates -y
Installation Guide
We use the official Docker image — the simplest and most maintainable approach.
1. Install Docker Engine
curl -fsSL https://get.docker.com | sudo sh
sudo usermod -aG docker $USER
newgrp docker
Verify Docker is running:
docker --version
docker compose version
2. Create Persistent Directories
sudo mkdir -p /opt/uptime-kuma
cd /opt/uptime-kuma
3. Create docker-compose.yml
services:
  uptime-kuma:
    image: louislam/uptime-kuma:1
    container_name: uptime-kuma
    restart: unless-stopped
    volumes:
      - ./data:/app/data
    ports:
      - "3001:3001"
Save the file, then start the stack:
docker compose up -d
docker compose ps
4. Initial Setup via Web UI
Open http://YOUR_SERVER_IP:3001 in your browser.
- Create the first admin account (this becomes the owner).
- Log in to the dashboard.
- Click Add New Monitor to create your first HTTP check.
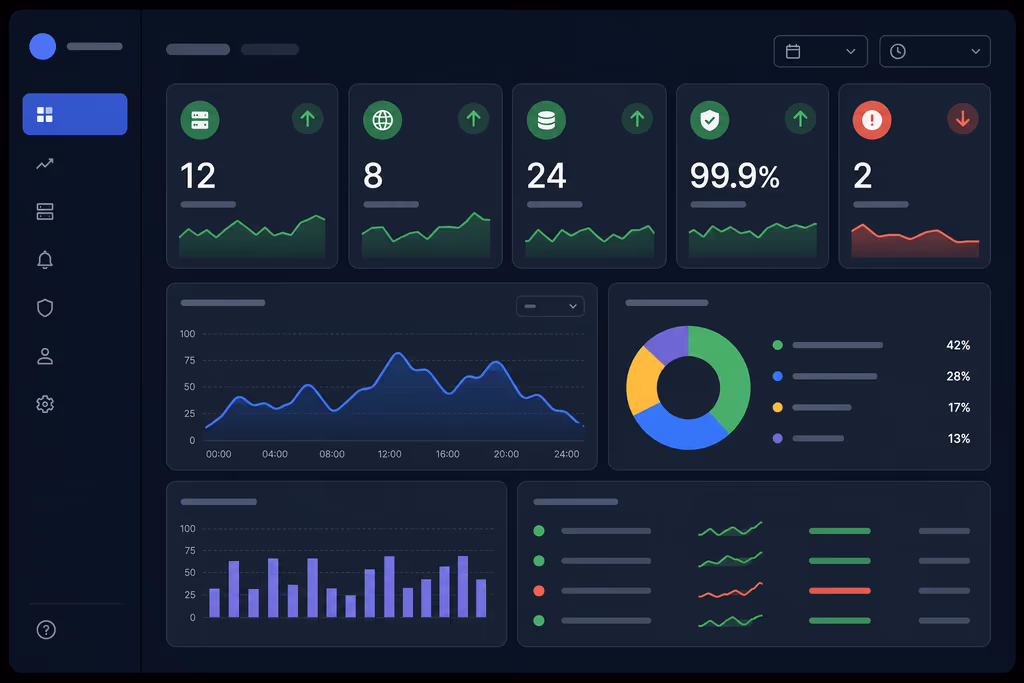
Caption: Uptime Kuma dashboard with monitor status cards and response-time overview.
5. Enable HTTPS with a Reverse Proxy (Recommended)
Option A — Caddy (automatic Let's Encrypt):
sudo apt install -y debian-keyring debian-archive-keyring apt-transport-https curl
curl -1sLf 'https://dl.cloudsmith.io/public/caddy/stable/gpg.key' | sudo gpg --dearmor -o /usr/share/keyrings/caddy-stable-archive-keyring.gpg
curl -1sLf 'https://dl.cloudsmith.io/public/caddy/stable/debian.deb.txt' | sudo tee /etc/apt/sources.list.d/caddy-stable.list
sudo apt update && sudo apt install caddy -y
Create /etc/caddy/Caddyfile entry:
monitor.yourdomain.com {
    reverse_proxy localhost:3001
}
Reload Caddy:
sudo systemctl reload caddy
Option B — Nginx with Certbot works equally well if you already use Nginx elsewhere.
Configuration
Monitor Examples
HTTP(s) website check:
- Monitor Type: HTTP(s)
- URL:
https://www.nzian.xyz - Heartbeat Interval: 60 seconds
- Retries: 3
- Accepted Status Codes: 200-299
TCP port check (e.g. MySQL):
- Monitor Type: Port
- Hostname:
db.internal.example.com - Port: 3306
Keyword check (verify page content):
- Monitor Type: HTTP(s) — Keyword
- URL:
https://your-app.com/health - Keyword:
"ok"
Notification Channels
- Go to Settings → Notifications.
- Click Setup Notification.
- Choose a provider (Telegram and Discord are popular for dev teams).
- Attach the notification to each monitor under Notifications.
Example Telegram setup:
- Create a bot via @BotFather.
- Paste the bot token into Uptime Kuma.
- Send
/startto your bot, then use Get chat ID in Uptime Kuma.
Status Page
Uptime Kuma can publish a public status page:
- Go to Status Pages → New Status Page.
- Add monitor groups (e.g. "Production APIs", "Client Sites").
- Set a slug like
statusand enable public access. - Share
https://monitor.yourdomain.com/status/your-slug.
Docker Socket Monitoring (Optional)
To monitor Docker containers on the same host, mount the Docker socket (security trade-off — use only on dedicated monitoring VPS):
volumes:
  - ./data:/app/data
  - /var/run/docker.sock:/var/run/docker.sock:ro
Usage
First-login checklist:
- Change default habits — use a unique strong password.
- Add monitors for every production URL you maintain.
- Configure at least two notification channels (e.g. Telegram + email).
- Create a status page for client-facing transparency.
- Test alerts by pausing a monitor or stopping a test container.
Daily workflow:
- Glance at the dashboard for green status bars.
- Review incident history when a monitor flips red.
- Adjust heartbeat intervals — 60s for critical APIs, 5m for low-priority internal tools.
Integrations worth exploring:
- Prometheus metrics endpoint (for Grafana dashboards)
- Maintenance windows before planned deploys
- Tags to group monitors by client or project
Troubleshooting
Common Issues & Fixes:
- Container won't start: Run
docker compose logs -f— usually a port conflict on 3001. Change the host port indocker-compose.yml. - Monitors show false positives: Increase retries and timeout; check if targets block Uptime Kuma's IP (Cloudflare bot rules, fail2ban).
- Notifications not firing: Re-test the notification provider; verify chat ID / webhook URL; check monitor is assigned to the notification.
- High CPU on small VPS: Reduce monitor count per instance or increase heartbeat intervals for non-critical checks.
- Data lost after rebuild: Ensure
./datavolume is mounted — never run without persistent storage. - HTTPS certificate errors on monitors: For self-signed targets, enable Ignore TLS/SSL errors per monitor (use cautiously).
- Upgrade Uptime Kuma:
docker compose pull && docker compose up -dfrom/opt/uptime-kuma.
For deeper issues, check the GitHub discussions and release notes before upgrading major versions.
Scaling, Securing, and Next Steps
- Backup: Copy
/opt/uptime-kuma/dataregularly; it holds all monitor config and history. - Separate monitoring VPS: Run Uptime Kuma on a different server than your apps — if one box dies, alerts still fire.
- Reverse-proxy auth: Add basic auth or SSO in front of the admin UI via Caddy/Nginx.
- High availability: Run a secondary Uptime Kuma instance elsewhere that monitors the primary instance.
- Pair with Grafana: Export metrics and build long-term trend dashboards.
- Automate deploys: Store
docker-compose.ymlin Git; redeploy with your existing CI/CD pipeline.
Uptime Kuma is one of the fastest wins in a self-hosted toolkit — deploy it early, monitor everything you ship, and sleep better during client launches.
References
- Official Site: https://uptime.kuma.pet/
- GitHub Repository: https://github.com/louislam/uptime-kuma
- Docker Hub Image: https://hub.docker.com/r/louislam/uptime-kuma
- Wiki & Docs: https://github.com/louislam/uptime-kuma/wiki
This guide equips you to run reliable, private uptime monitoring on your own VPS. Start with your most critical URLs, expand coverage over time, and keep backups of the data directory.
Conclusion
Self-hosting Uptime Kuma takes under thirty minutes with Docker and immediately improves how you respond to outages. The combination of flexible check types, polished dashboards, and multi-channel alerts makes it a staple for sysadmins and Laravel freelancers managing client infrastructure. Deploy it, wire up notifications, and make downtime something you learn about in seconds — not hours.