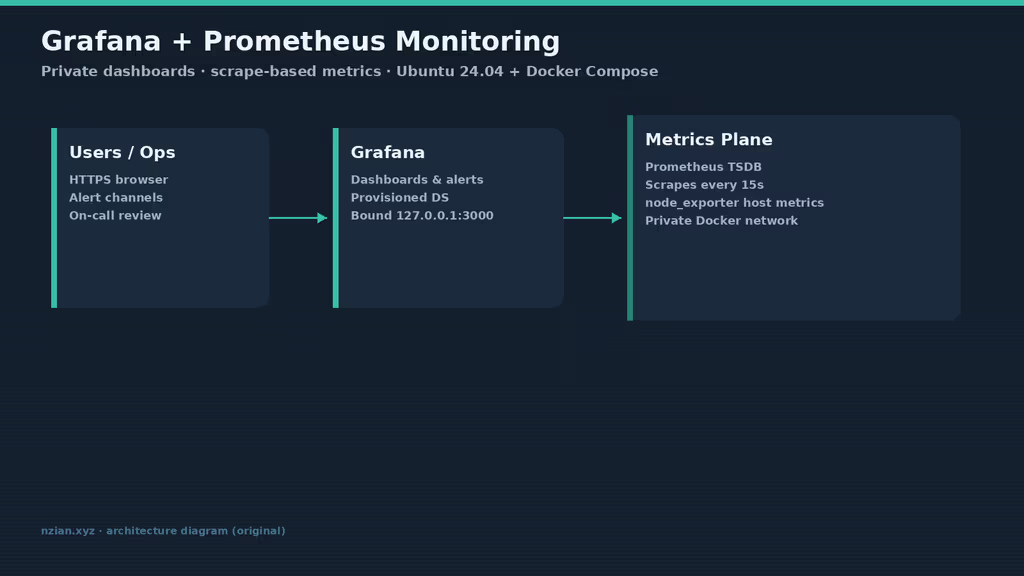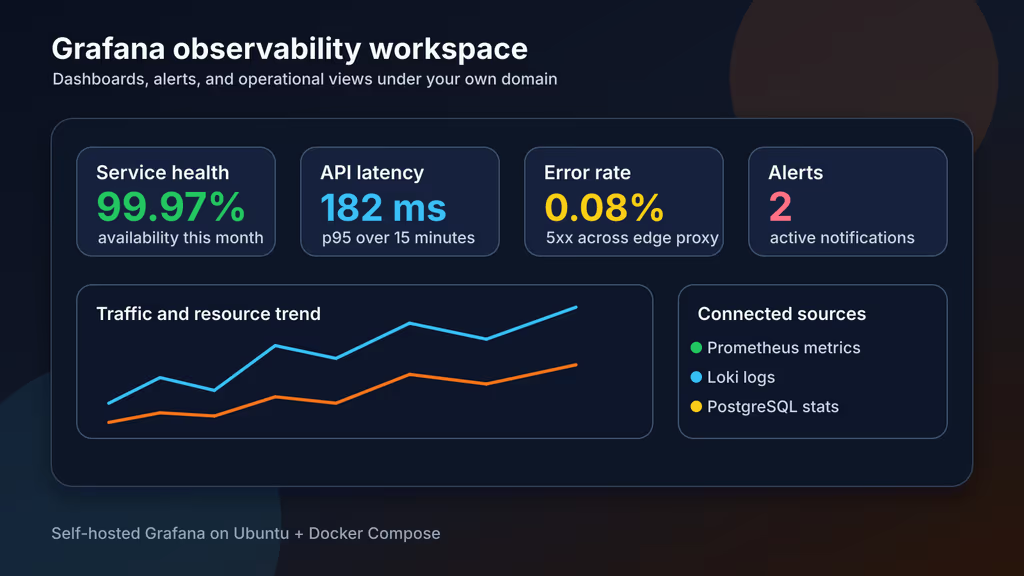
Caption: Grafana on localhost:3000, Nginx on 443. It draws panels. Prometheus (or whatever I point it at) still has to collect the numbers.
Why I wanted this on my server
I was tired of metrics living in someone else's account. I wanted a board on grafana.example.com that I back up with the rest of the box.
Grafana does not scrape your VPS by itself. It queries data sources. This post is Grafana OSS on Docker: HTTPS, a named volume, file provisioning, a backup I can restore. Pair it with Prometheus later. Day one is a login that still works after I forget the generated password.
What I actually installed
/opt/grafana, grafana/grafana:latest on 127.0.0.1:3000, volume grafana_data, provisioning dirs bind-mounted. 1–2 GB RAM is enough for a personal instance. SSD. Off-server copies of the volume and the Compose tree.
Where it broke
On a fresh Ubuntu 24.04 box this install is famous for ignoring .env after the first boot.
I generated GF_SECURITY_ADMIN_PASSWORD, logged in, then decided the password was ugly and edited .env. Restart. Old password still worked. New one did not.
Those env vars apply when Grafana creates the admin user. After that, change the password in the UI or:
cd /opt/grafana
NEW_ADMIN_PASSWORD="$(openssl rand -base64 36 | tr -d '\n')"
docker compose exec grafana grafana cli admin reset-admin-password "${NEW_ADMIN_PASSWORD}"
printf 'New Grafana admin password: %s\n' "${NEW_ADMIN_PASSWORD}"
I put the new value in the password manager immediately.
If dashboards say "no data", Save & test on the data source and check that the Grafana container can resolve that URL — not my laptop.
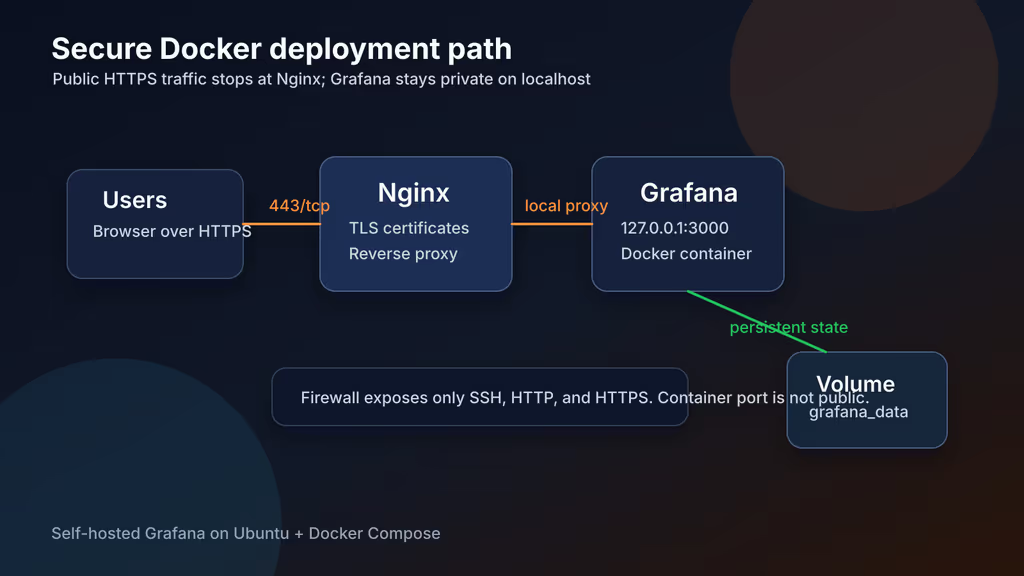
Caption: Nginx publishes HTTPS. Grafana stays on 127.0.0.1 with state in grafana_data.
Prerequisites
Docker + Compose v2, Nginx, Certbot, curl, jq, openssl. At least one data source later (Prometheus is the usual partner). Disable sign-up. Do not publish 3000.
sudo apt update
sudo apt upgrade -y
sudo apt install -y ca-certificates curl gnupg jq openssl ufw nginx certbot python3-certbot-nginx

sudo ufw allow OpenSSH
sudo ufw allow 80/tcp
sudo ufw allow 443/tcp
sudo ufw enable
sudo ufw status
The working install
1. Install Docker Engine
curl -fsSL https://get.docker.com | sudo sh
sudo usermod -aG docker "$USER"
newgrp docker

docker --version
docker compose version
2. Create the project directory
sudo mkdir -p /opt/grafana/{provisioning/datasources,provisioning/dashboards,dashboards,backups}
sudo chown -R "$USER":"$USER" /opt/grafana
chmod 700 /opt/grafana
chmod 700 /opt/grafana/backups
cd /opt/grafana
3. Generate secrets and create .env
cd /opt/grafana

GRAFANA_ADMIN_PASSWORD_VALUE="$(openssl rand -base64 36 | tr -d '\n')"

cat > .env <<EOF
GF_SERVER_DOMAIN=grafana.example.com
GF_SERVER_ROOT_URL=https://grafana.example.com/
GF_SECURITY_ADMIN_USER=admin
GF_SECURITY_ADMIN_PASSWORD=${GRAFANA_ADMIN_PASSWORD_VALUE}
GF_USERS_ALLOW_SIGN_UP=false
GF_AUTH_ANONYMOUS_ENABLED=false
GF_ANALYTICS_REPORTING_ENABLED=false
GF_LOG_LEVEL=info
EOF

chmod 600 .env
printf 'Initial Grafana admin password: %s\n' "${GRAFANA_ADMIN_PASSWORD_VALUE}"
Save that password before first start. After users exist, .env will not silently reset admin.
4. Create compose.yaml
services:
  grafana:
    image: grafana/grafana:latest
    container_name: grafana
    restart: unless-stopped
    env_file: ./.env
    ports:
      - "127.0.0.1:3000:3000"
    volumes:
      - grafana_data:/var/lib/grafana
      - ./provisioning:/etc/grafana/provisioning:ro
      - ./dashboards:/var/lib/grafana/dashboards:ro
    healthcheck:
      test: ["CMD-SHELL", "curl -fsS http://localhost:3000/api/health || exit 1"]
      interval: 30s
      timeout: 10s
      retries: 5

volumes:
  grafana_data:
    name: grafana_data
grafana/grafana-enterprise exists and includes OSS plus optional extras. I used grafana/grafana for a private board.
5. Start Grafana
cd /opt/grafana
docker compose config
docker compose pull
docker compose up -d
docker compose ps
docker compose logs --since=2m grafana
curl -s http://127.0.0.1:3000/api/health | jq
If health fails, logs before Nginx. Permission errors on /var/lib/grafana usually mean the named volume is not attached.
6. Configure Nginx and HTTPS
Create /etc/nginx/sites-available/grafana.example.com:
server {
    listen 80;
    listen [::]:80;
    server_name grafana.example.com;

    location / {
        proxy_http_version 1.1;
        proxy_set_header Host $host;
        proxy_set_header X-Real-IP $remote_addr;
        proxy_set_header X-Forwarded-For $proxy_add_x_forwarded_for;
        proxy_set_header X-Forwarded-Proto $scheme;
        proxy_set_header Upgrade $http_upgrade;
        proxy_set_header Connection "upgrade";
        proxy_pass http://127.0.0.1:3000;
    }
}
Wrong host on links or OAuth callbacks: GF_SERVER_ROOT_URL, GF_SERVER_DOMAIN, and X-Forwarded-Proto.
sudo ln -s /etc/nginx/sites-available/grafana.example.com /etc/nginx/sites-enabled/grafana.example.com
sudo nginx -t
sudo systemctl reload nginx

sudo certbot --nginx -d grafana.example.com
sudo systemctl reload nginx
One thing you shold keep in mind
File provisioning beats clicking forever — until you edit a provisioned dashboard in the UI and it snaps back because allowUiUpdates: false. I change JSON in Git, not the panel editor, for those boards.
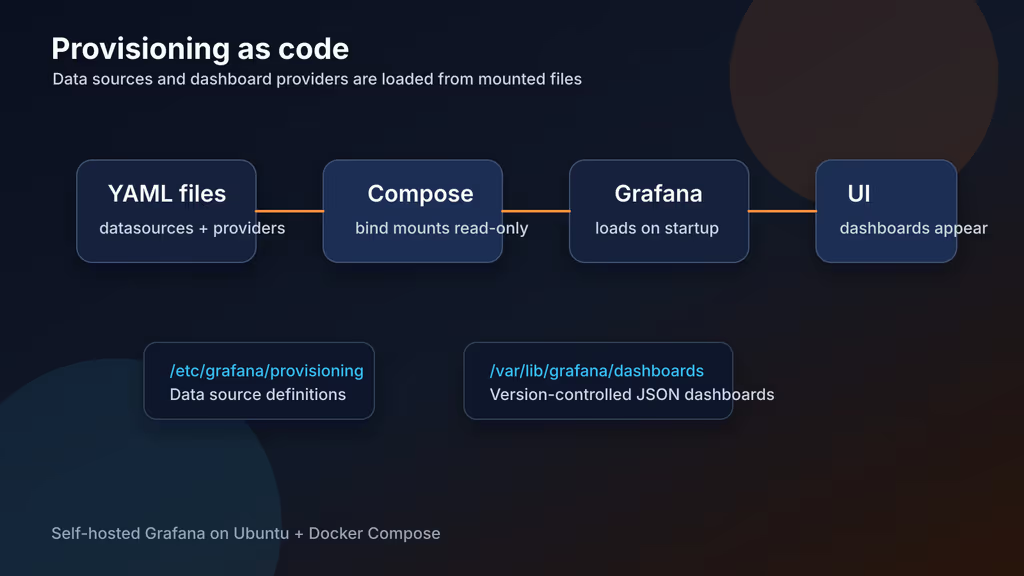
Caption: Data sources and dashboard providers as files. Rebuild the container and the board is still there.
provisioning/datasources/prometheus.yaml if Prometheus is reachable from the Grafana network:
apiVersion: 1

datasources:
  - name: Prometheus
    type: prometheus
    access: proxy
    url: http://prometheus.example.internal:9090
    isDefault: true
    editable: false
cd /opt/grafana
docker compose restart grafana
docker compose logs --since=1m grafana
provisioning/dashboards/default.yaml:
apiVersion: 1

providers:
  - name: Local dashboards
    orgId: 1
    folder: Operations
    type: file
    disableDeletion: false
    updateIntervalSeconds: 30
    allowUiUpdates: false
    options:
      path: /var/lib/grafana/dashboards
      foldersFromFilesStructure: true
Exported JSON goes under /opt/grafana/dashboards.
Plugins live under /var/lib/grafana/plugins inside grafana_data. Recreate the container without the volume and they vanish.
First dashboard I actually used
Named accounts, then change the initial admin password. One data source, one folder (Operations), one host dashboard: CPU, memory, disk, network. Alert only after panels look true. Test the contact point while I am awake.
Backup, expose, next step
cd /opt/grafana
mkdir -p backups

tar czf "backups/grafana-config-$(date +%F).tgz" \
  compose.yaml .env provisioning dashboards

docker run --rm \
  -v grafana_data:/data:ro \
  -v "$PWD/backups:/backup" \
  alpine sh -c 'cd /data && tar czf /backup/grafana-data-$(date +%F).tgz .'

ls -lh backups
Restore: Docker on a new host, unpack config, recreate grafana_data, unpack the data tarball with a throwaway container, docker compose up -d.
cd /opt/grafana
docker compose pull
docker compose up -d
docker compose logs --since=2m grafana
curl -s http://127.0.0.1:3000/api/health | jq
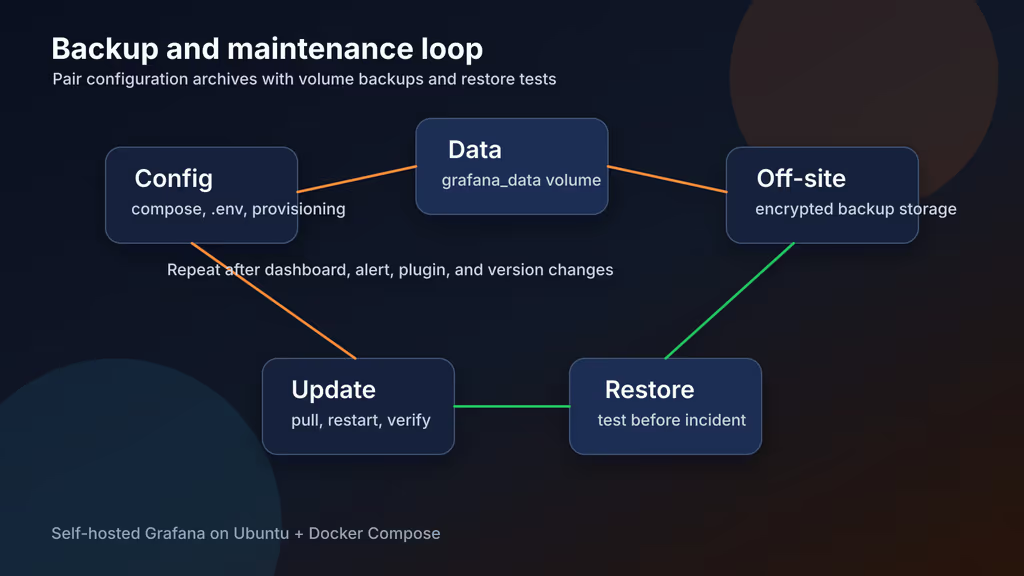
Caption: Volume plus provisioning files. Dashboards in SQLite are not in Git unless I exported them.
What I have running now is Grafana OSS on HTTPS, sign-up off, provisioning dirs in place. Next I attach Prometheus (or the collector I already have) and one alert that actually pages me.
Did you hit the same wall?
I got stuck on GF_SECURITY_ADMIN_PASSWORD in .env doing nothing after first boot — I had to run grafana cli admin reset-admin-password. Did you hit the same thing, or a different one? Tell me in the comments. I read them.
Need this done on your server?
I deploy and harden Laravel/CodeCanyon apps on cPanel or VPS, and offer monthly Server Watch retainers. Hire for deploy · Care plan