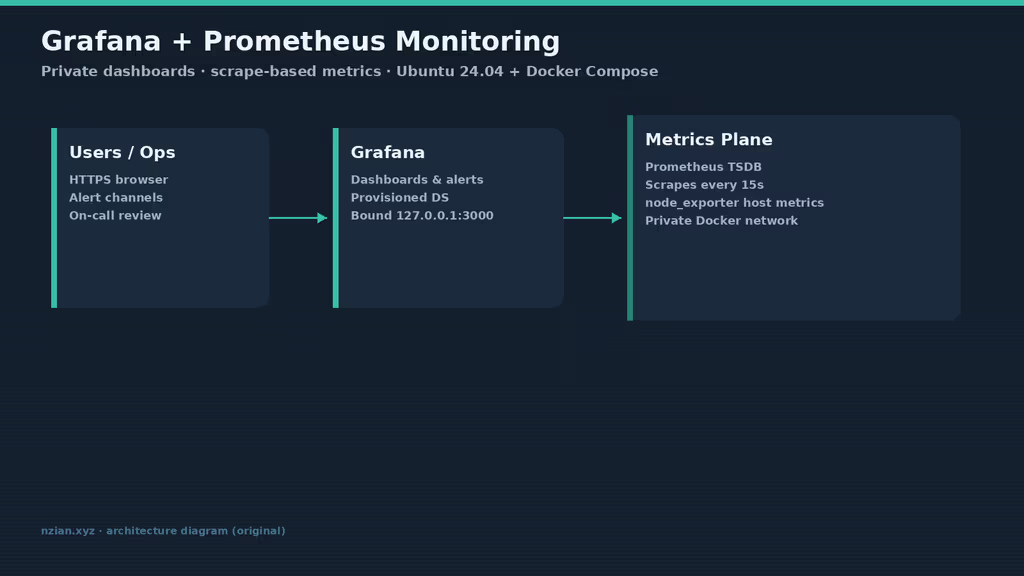
Caption: Grafana UI, Prometheus scrape, node_exporter — metrics stay on the VPS.
Why I wanted this on my server
I was SSH-ing into boxes to run htop after something felt slow. I wanted CPU, memory, and disk on a dashboard I control, not another observability vendor. Grafana draws the boards. Prometheus scrapes and stores. node_exporter exposes Linux host metrics. Three containers, Nginx for HTTPS, YAML under /opt/monitoring. Homelabs and small teams that already run Docker can keep metrics next to the workloads. I version-control provisioning files so a rebuilt VPS still has a data source.
Grafana does not collect metrics by itself. That pairing is the whole point. I started with one scrape target and a handful of panels before thinking about cAdvisor, blackbox probes, or remote write.
What I actually installed
Ubuntu 24.04 LTS, Docker Compose, grafana/grafana, prom/prometheus, quay.io/prometheus/node-exporter, Grafana and Prometheus bound to localhost (3000 / 9090), Nginx + Certbot for https://grafana.example.com. Provisioned Prometheus data source. 15-day TSDB retention.
Hardware: 2 vCPU / 2 GB for Grafana + Prometheus + node_exporter on a lightly loaded host; 2–4 vCPU / 4 GB if retention grows. 20 GB+ SSD for images, the Prometheus TSDB, Grafana data, and local backup staging. Off-server storage for Compose, .env, and volume archives. Optional second host later for remote scrape targets.
Security I would not skip: bind Grafana (3000) and Prometheus (9090) to 127.0.0.1, never publish scrape ports to the public internet, keep node_exporter on the Compose network without opening 9100 in UFW, disable public sign-up, treat .env and backup tarballs as sensitive, prefer pinned image tags once a known-good release is verified.
Where it broke
On a fresh Ubuntu 24.04 box this stack is famous for Grafana data source test failed because the URL is http://localhost:9090.
Inside the Grafana container, localhost is Grafana, not Prometheus. Provisioning (and the UI) must use the Compose DNS name:
url: http://prometheus:9090
Both services on the monitoring network. After that, Save & test went green.
Second: Grafana 502 from Nginx. Container still starting, or not bound to 127.0.0.1:3000. Check docker compose ps and ss -tlnp | grep 3000.
Third: node job DOWN. Service name in prometheus.yml must match Compose (node-exporter:9100). Missing --path.rootfs=/host and the /:/host:ro,rslave mount makes node_exporter lie about the container instead of the host.
I left Prometheus on localhost (SSH tunnel) and did not proxy :9090 to the internet.
Other documented issues: empty panels — wrong metric names, time range too short after first start, or scrape interval not elapsed; try raw PromQL in Explore. Permission errors on the Grafana volume — named volumes are simpler on Ubuntu than arbitrary host UID remaps. Prometheus disk growth — lower --storage.tsdb.retention.time, drop high-cardinality jobs, watch /var/lib/docker. Certbot / Nginx failures — DNS and port 80 for HTTP-01. Official Grafana docs also document grafana/grafana-enterprise; this lab uses OSS grafana/grafana. Do not point production alerts at a personal inbox I ignore.
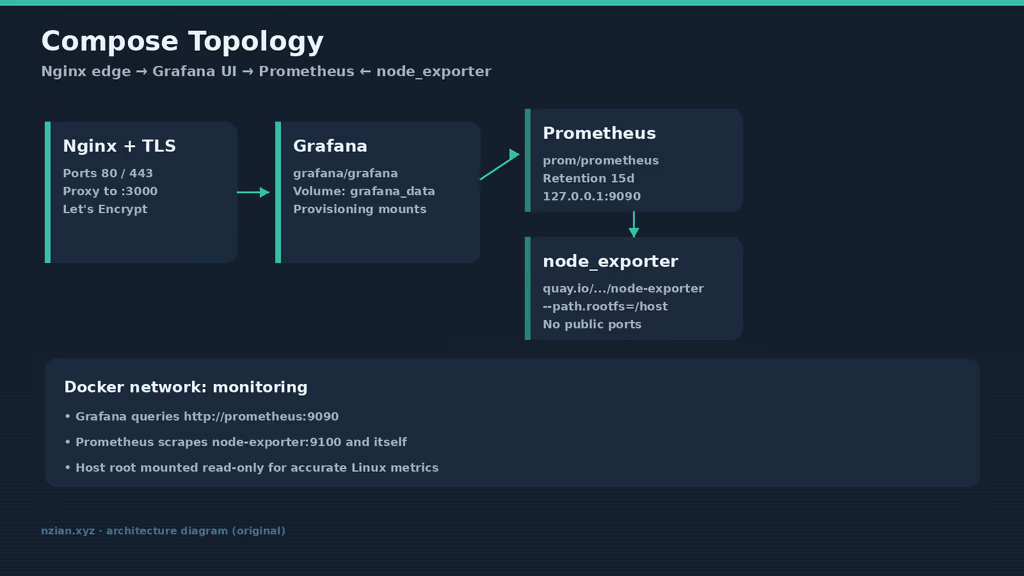
Caption: Nginx for Grafana; Prometheus scrapes node_exporter on a private network.
The working install
sudo apt update
sudo apt upgrade -y
sudo apt install -y ca-certificates curl gnupg jq openssl ufw nginx certbot python3-certbot-nginx

sudo ufw allow OpenSSH
sudo ufw allow 80/tcp
sudo ufw allow 443/tcp
sudo ufw enable
sudo ufw status
1. Install Docker Engine
sudo apt-get update -qqy
sudo apt-get install ca-certificates curl -qqy
sudo install -m 0755 -d /etc/apt/keyrings
sudo curl -fsSL https://download.docker.com/linux/ubuntu/gpg -o /etc/apt/keyrings/docker.asc
sudo chmod a+r /etc/apt/keyrings/docker.asc

echo \
  "deb [arch=$(dpkg --print-architecture) signed-by=/etc/apt/keyrings/docker.asc] https://download.docker.com/linux/ubuntu \
  $(. /etc/os-release && echo "$VERSION_CODENAME") stable" | \
  sudo tee /etc/apt/sources.list.d/docker.list > /dev/null

sudo apt-get update -qqy
sudo apt-get install docker-ce docker-ce-cli containerd.io docker-compose-plugin -qqy

sudo usermod -aG docker "$USER"
newgrp docker

docker --version
docker compose version
docker run --rm hello-world
If the Docker group is inactive, log out and back in.
2. Create the project directory
sudo mkdir -p /opt/monitoring/{prometheus,grafana/provisioning/datasources,grafana/provisioning/dashboards,grafana/dashboards,backups}
sudo chown -R "$USER":"$USER" /opt/monitoring
chmod 700 /opt/monitoring
chmod 700 /opt/monitoring/backups
cd /opt/monitoring
3. Generate secrets and create .env
cd /opt/monitoring

GRAFANA_ADMIN_PASSWORD_VALUE="$(openssl rand -base64 36 | tr -d '\n')"

cat > .env <<EOF
GF_SERVER_DOMAIN=grafana.example.com
GF_SERVER_ROOT_URL=https://grafana.example.com/
GF_SECURITY_ADMIN_USER=admin
GF_SECURITY_ADMIN_PASSWORD=${GRAFANA_ADMIN_PASSWORD_VALUE}
GF_USERS_ALLOW_SIGN_UP=false
GF_AUTH_ANONYMOUS_ENABLED=false
GF_ANALYTICS_REPORTING_ENABLED=false
GF_LOG_LEVEL=info
EOF

chmod 600 .env
printf 'Initial Grafana admin password: %s\n' "${GRAFANA_ADMIN_PASSWORD_VALUE}"
4. Write Prometheus configuration
/opt/monitoring/prometheus/prometheus.yml:
global:
  scrape_interval: 15s
  evaluation_interval: 15s

scrape_configs:
  - job_name: prometheus
    static_configs:
      - targets: ["prometheus:9090"]

  - job_name: node
    static_configs:
      - targets: ["node-exporter:9100"]
5. Provision the Grafana Prometheus data source
/opt/monitoring/grafana/provisioning/datasources/prometheus.yml:
apiVersion: 1

datasources:
  - name: Prometheus
    type: prometheus
    access: proxy
    url: http://prometheus:9090
    isDefault: true
    editable: false
/opt/monitoring/grafana/provisioning/dashboards/default.yml:
apiVersion: 1

providers:
  - name: Local dashboards
    orgId: 1
    folder: Operations
    type: file
    disableDeletion: false
    updateIntervalSeconds: 30
    allowUiUpdates: true
    options:
      path: /var/lib/grafana/dashboards
Drop exported dashboard JSON into /opt/monitoring/grafana/dashboards/ after login.
6. Create compose.yaml
services:
  grafana:
    image: grafana/grafana:latest
    container_name: grafana
    restart: unless-stopped
    env_file: ./.env
    ports:
      - "127.0.0.1:3000:3000"
    volumes:
      - grafana_data:/var/lib/grafana
      - ./grafana/provisioning:/etc/grafana/provisioning:ro
      - ./grafana/dashboards:/var/lib/grafana/dashboards:ro
    depends_on:
      - prometheus
    networks:
      - monitoring
    healthcheck:
      test: ["CMD-SHELL", "wget -qO- http://127.0.0.1:3000/api/health || exit 1"]
      interval: 30s
      timeout: 10s
      retries: 5

  prometheus:
    image: prom/prometheus:latest
    container_name: prometheus
    restart: unless-stopped
    command:
      - "--config.file=/etc/prometheus/prometheus.yml"
      - "--storage.tsdb.path=/prometheus"
      - "--storage.tsdb.retention.time=15d"
      - "--web.enable-lifecycle"
    ports:
      - "127.0.0.1:9090:9090"
    volumes:
      - ./prometheus/prometheus.yml:/etc/prometheus/prometheus.yml:ro
      - prometheus_data:/prometheus
    networks:
      - monitoring

  node-exporter:
    image: quay.io/prometheus/node-exporter:latest
    container_name: node-exporter
    restart: unless-stopped
    command:
      - "--path.rootfs=/host"
    pid: host
    volumes:
      - "/:/host:ro,rslave"
    networks:
      - monitoring
    # No published ports — Prometheus scrapes over the Compose network only

networks:
  monitoring:
    name: monitoring

volumes:
  grafana_data:
    name: grafana_data
  prometheus_data:
    name: prometheus_data
Official Grafana docs also mention grafana/grafana-enterprise. This lab uses OSS grafana/grafana. node_exporter flags follow the Prometheus container guidance.
7. Start the stack
cd /opt/monitoring
docker compose config
docker compose pull
docker compose up -d
docker compose ps
docker compose logs --since=2m
curl -s http://127.0.0.1:3000/api/health | jq
curl -s http://127.0.0.1:9090/-/ready
curl -s http://127.0.0.1:9090/api/v1/targets | jq '.data.activeTargets[] | {job: .labels.job, health: .health}'
Expect both scrape jobs up.
8. Configure Nginx and HTTPS
Create /etc/nginx/sites-available/grafana.example.com:
server {
    listen 80;
    listen [::]:80;
    server_name grafana.example.com;

    location / {
        proxy_http_version 1.1;
        proxy_set_header Host $host;
        proxy_set_header X-Real-IP $remote_addr;
        proxy_set_header X-Forwarded-For $proxy_add_x_forwarded_for;
        proxy_set_header X-Forwarded-Proto $scheme;
        proxy_set_header Upgrade $http_upgrade;
        proxy_set_header Connection "upgrade";
        proxy_pass http://127.0.0.1:3000;
    }
}
sudo ln -s /etc/nginx/sites-available/grafana.example.com /etc/nginx/sites-enabled/grafana.example.com
sudo nginx -t
sudo systemctl reload nginx

sudo certbot --nginx -d grafana.example.com
sudo systemctl reload nginx
Sign in at https://grafana.example.com with the generated admin password.
Configuration
GF_SERVER_ROOT_URL— public HTTPS URLGF_USERS_ALLOW_SIGN_UP=falseGF_AUTH_ANONYMOUS_ENABLED=false- Retention
--storage.tsdb.retention.time=15d
curl -X POST http://127.0.0.1:9090/-/reload
Requires --web.enable-lifecycle. Validate first:
docker compose exec prometheus promtool check config /etc/prometheus/prometheus.yml
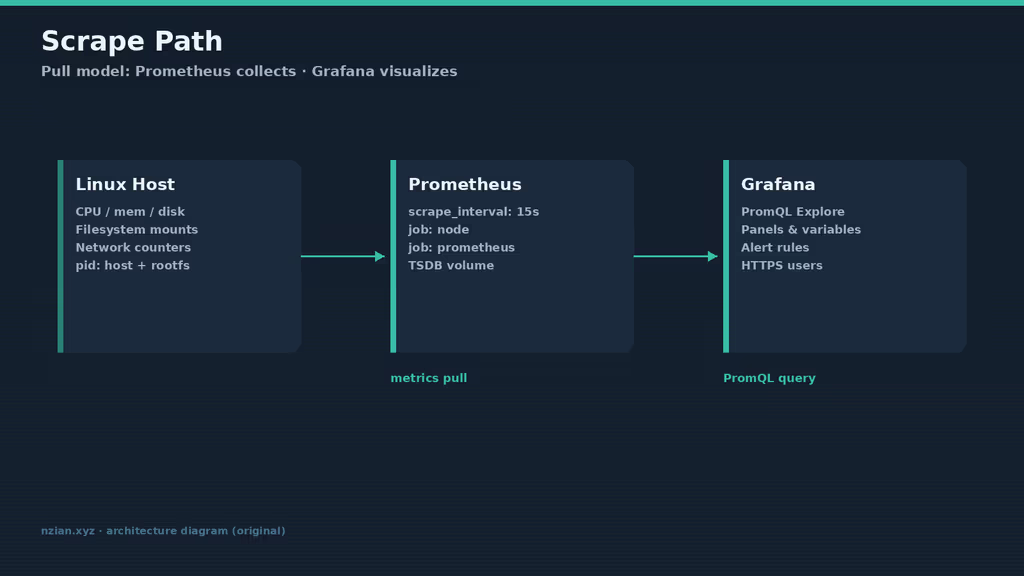
Caption: Prometheus pulls node_exporter; Grafana queries Prometheus on the same network.
Helpful information
File-based provisioning. Data sources and dashboard providers in Git mean a rebuilt VPS still has Prometheus attached. I almost only clicked the UI, then lost the data source on a volume recreate. editable: false on the provisioned source stopped me from “fixing” it back to localhost.
Forgot admin password: Grafana CLI reset inside the container after a volume backup — do not delete grafana_data.
Usage
- Sign in as
admin, change the password. - Connections → Data sources — Prometheus provisioned, Save & test green.
- Prometheus UI via SSH tunnel to
127.0.0.1:9090→ Status → Targets bothUP. - Dashboard: CPU
100 - (avg by (instance) (rate(node_cpu_seconds_total{mode="idle"}[5m])) * 100), memorynode_memory_MemAvailable_bytes, disknode_filesystem_avail_bytes{mountpoint="/"}. - Alerting: contact point you actually read, then a disk-free rule.
Empty panels after first start: wait a scrape interval, or the time range is too short.
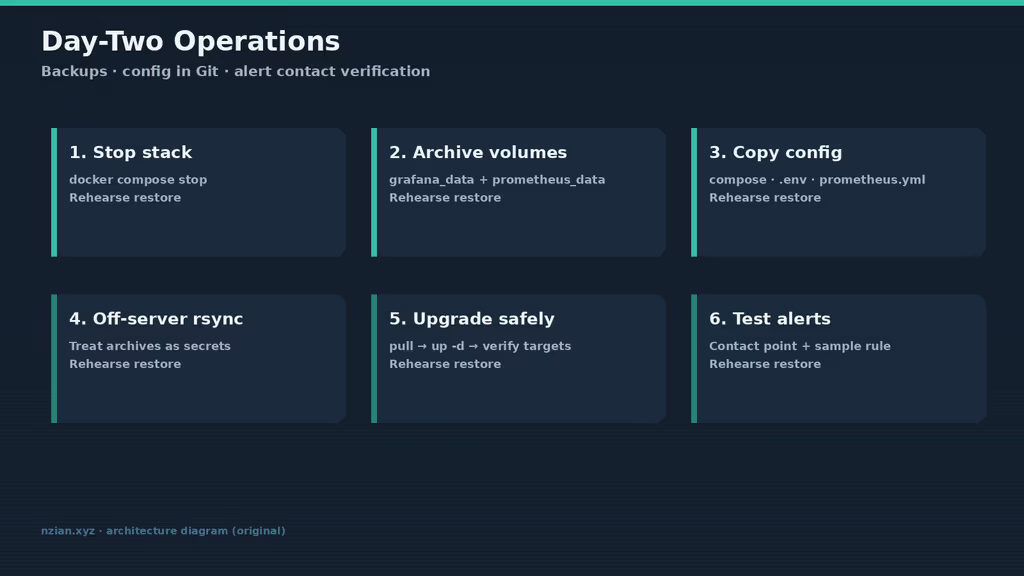
Caption: Volume backups, prometheus.yml in Git, contact points after upgrades.
Backup, expose, next step
cd /opt/monitoring
docker compose stop

sudo mkdir -p /var/backups/monitoring
docker run --rm \
  -v grafana_data:/data:ro \
  -v /var/backups/monitoring:/backup \
  alpine:3.20 \
  sh -c 'cd /data && tar czf /backup/grafana-data.tgz .'

docker run --rm \
  -v prometheus_data:/data:ro \
  -v /var/backups/monitoring:/backup \
  alpine:3.20 \
  sh -c 'cd /data && tar czf /backup/prometheus-data.tgz .'

cp compose.yaml .env prometheus/prometheus.yml /var/backups/monitoring/
rsync -a /var/backups/monitoring/ backup-user@backup.example.net:/srv/backups/monitoring/

docker compose start
cd /opt/monitoring
docker compose pull
docker compose up -d
docker compose ps
docker compose logs --since=2m
What I have running now: Grafana + Prometheus + node_exporter on Ubuntu 24.04, HTTPS for the UI, provisioned Prometheus at http://prometheus:9090, host panels, 15-day retention, scrape ports off the public firewall. Reboot with restart: unless-stopped brought the stack back. Next: pin image versions, one alert I will actually see, maybe cAdvisor later, SSO or VPN if this becomes shared. I still would not expose :9090 or :9100. I would document who owns on-call before the first firing rule goes to a real channel.
Did you hit the same wall?
I got stuck on Grafana’s Prometheus data source pointing at localhost:9090 instead of http://prometheus:9090 on the Compose network. Did you hit the same thing, or a different one — 502 from Nginx, node job DOWN, empty panels? Tell me in the comments. I read them.
Need this done on your server?
I deploy and harden Laravel/CodeCanyon apps on cPanel or VPS, and offer monthly Server Watch retainers. Hire for deploy · Care plan